The Analytics feature lets you see your site search analytics. By analyzing customers’ behavior in your store, you can understand what your potential customers want and how to help them find what they need. After that, you can make some changes in the app or store to improve customers’ search experience and, as a result, your profit.
Overview
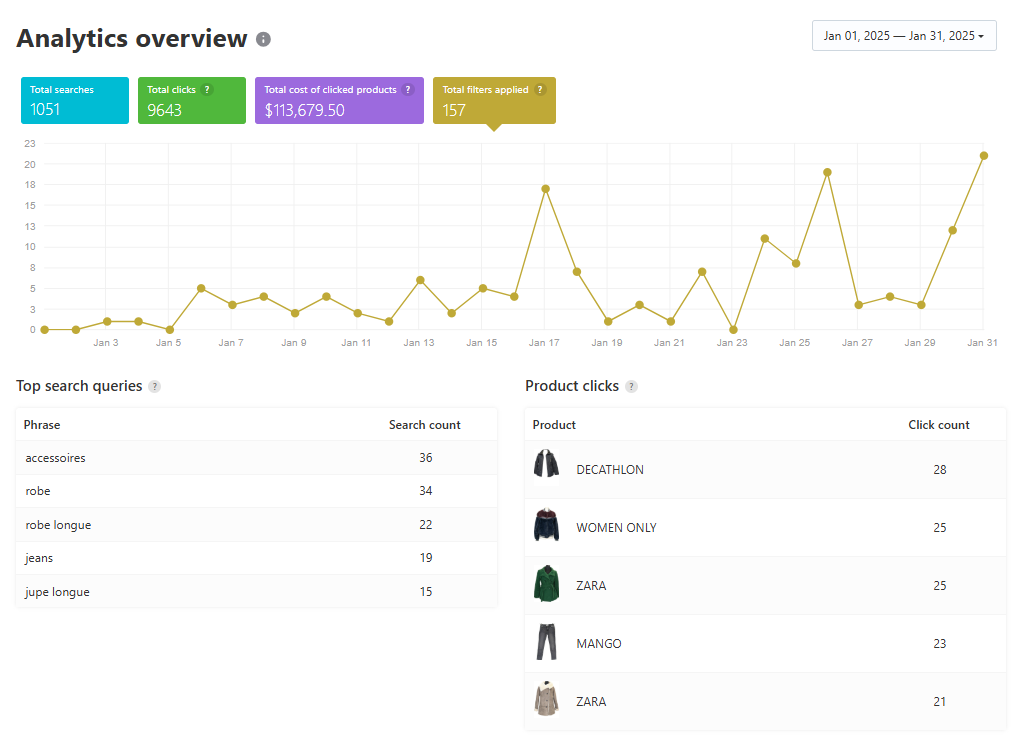
In the Overview section, you can see:
- Line chart – the dynamics of search queries.
- Top search queries – 5 most searched queries by your customers.
- Top search with no results – 5 search queries that yielded no results.
- Top product clicks – 5 products that received the most clicks in the search results.
- Top bought products – 5 most frequently purchased products from the search results. These are items that customers added to their carts and then proceeded to checkout.
- Top filters – 5 most commonly used filters in the Search Results Widget.
- Top filter values – 5 most frequently applied filter values in the Search Results Widget.
- Top viewed collections – 5 most frequently clicked collections (if Filter on collections are enabled).
All data is represented for a certain period selected in the top-right corner of the section:
Search analytics
- Queries – all search queries, their performance in clicks and purchases, and generated revenue. Available if the Search Results Widget is enabled.
-
-
Search phrase – specific terms your customers used over a selected period.
-
Products bought – number of products purchased following a specific search query.
-
Revenue – total revenue generated from products purchased after a specific search query.
-
CTR (Click-through rate) shows how often a search query leads to clicks. Formula: Clicks related to the query ÷ Queries.
-
CR (Conversion rate) shows how often a search query leads to purchases. Formula: Orders related to the query ÷ Queries.
Query data is available from April 8, 2025. Product, revenue, and conversion data is available from October 22, 2025.
-
- All interactions – all actions performed by customers on the Search Results Widget.
- 0 results – all search queries that have produced no results over a certain period (the data is collected if the Search Results Widget is enabled).
- Suggestions – all search suggestions your customers clicked over a certain period.
- Product performance shows how individual products perform in your search results.
- Product – the item found through search.
- Clicks – total number of times customers clicked on this product.
- Clicks in ISW – сlicks made from the Instant search widget.
- CTR (Click-through rate) shows how often users click on this product after seeing it in search results. Formula: Clicks ÷ Impressions.
- Products bought – how many times this product was purchased after being found via search.
- Revenue – total income generated by this product following search interactions.
- CR (Conversion rate) shows how often a click on this product leads to a successful purchase. Formula: Orders ÷ Clicks.
- Products Clicked – all products your customers clicked from the search results over a certain period.
- Products Bought – all products your customers purchased from the search results over a certain period. The bought products are products that customers added to the cart and then went to check out.
- Filters – all filters applied in the Search Results Widget. Available from November 30, 2024.
- Filter values – all filter values selected in the Search Results Widget. Available from November 30, 2024.
- Filter value combinations – all cases when several filters were applied simultaneously. Available from March 17, 2025.
You can use the search bar to find information about a particular value in each tab. However, this search is not available for the slider filter.
Collections analytics
The reports have data if Filters on Collections are enabled. Select a date range and choose one or more collections from the dropdown:
- Collections — collection views, clicks on collection products, conversion rate (Orders ÷ Clicks), and revenue. Available from January 28, 2026.
- Filters – all filters applied in Filters on Collections. Available from November 30, 2024.
- Filter values – all filter values selected in Filters on Collections. Available from November 30, 2024.
- Filter value combinations – all cases when several filters were applied simultaneously. Available from March 17, 2025.
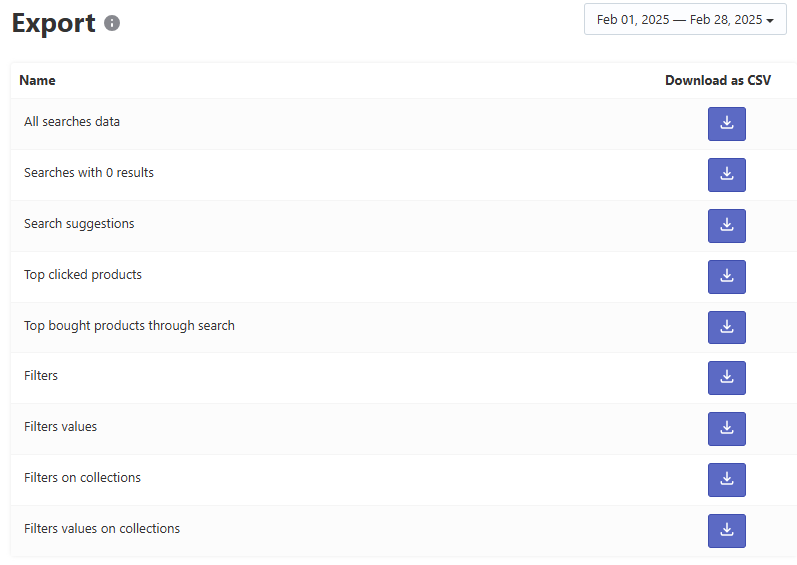
Export analytics
You can export any report as a CSV file:
- Go to the Export section.
- Set the period you want to get the data in the top-right corner.
- Click the Download button.
Settings
Track checkout activities. There are several ways to collect data about the products bought by your customers. The setting provides a more precise way to get this information: we check if the customers’ orders include products found and purchased through Searhanise widgets.
Ignore IPs. To ensure accurate data, exclude your team’s IP addresses from the analysis:
- Find IPs you want to ignore (personal IPs or IP of your local network).
- Go to the Analytics > Settings section.
- Enter IPs separated by commas into the Ignore IPs text box.
- Apply the changes.
That’s it. Analytics will not be collected from these IP addresses.
Receive reports by email. You can receive analytics reports via email each month. You can change these mailing preferences on the Settings page.