The Analytics feature allows you to evaluate the performance of widgets and the revenue they generate. This data is designed to support your decision-making processes, refine marketing strategies, and enhance overall conversion rates.
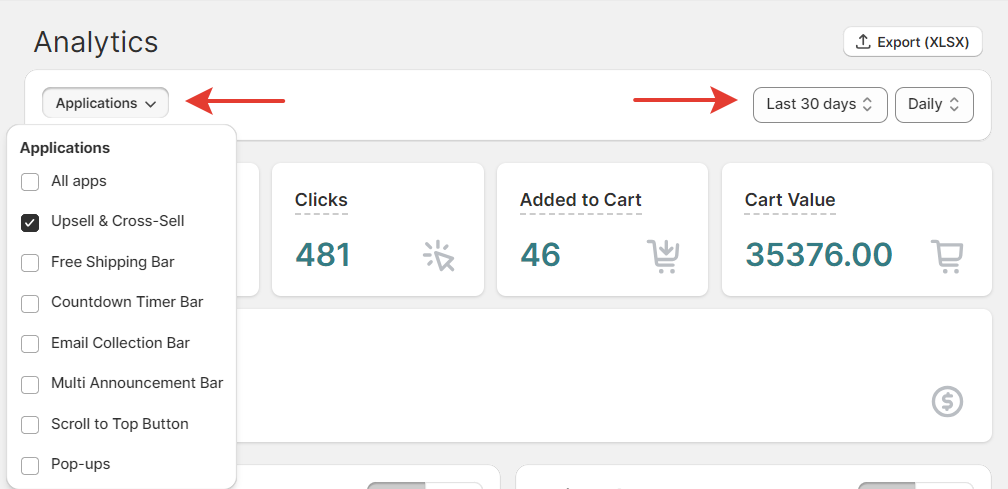
In the top left corner, you may choose the feature for which the analytics is displayed by clicking the Applications dropdown. In the top right corner, choose a specific timeframe for data collection and period to display.
Here are the metrics common for all the widgets:
- Impressions — number of times Searchanise Upsell & Marketing widgets (which include recommendations, bars, and pop-ups) are displayed in your store
- Clicks — number of user interactions with widgets. It means the user pressed a call-to-action button, link, or other interactive elements.
The graphs below display the data over time separately for desktop and mobile users.
Actions and limitations
You can view and export your data (the Export button in the top right corner). However, certain limitations apply based on your plan:
- on a free plan, you can only view the data within the last 30 days, export is not available
- all paid plans provide unlimited data access and export
- clients that are not on the up-to-date plans cannot see the Analytics. We recommend to resubscribe to gain the full service of the app.
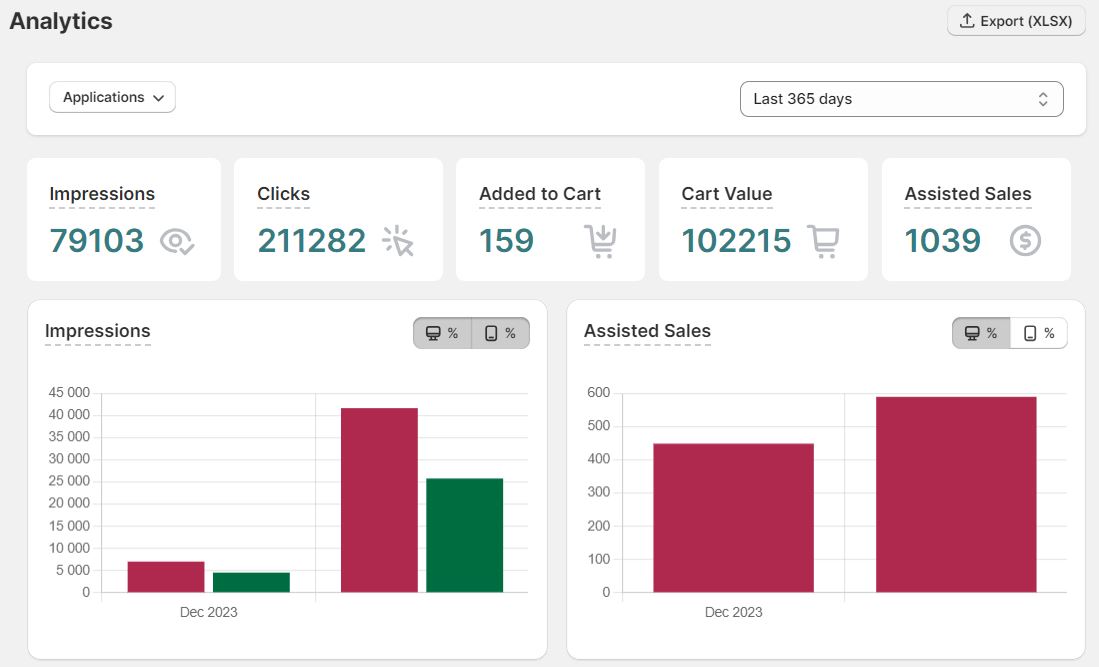
Analytics for Upsell & Cross-Sell
The Upsell & Cross-Sell widgets display product recommendations. The Analytics data for these widgets includes:
- Impressions — total number of times the widgets were displayed in your store.
- Clicks — the number of times the users pressed any elements.
- Added to cart — the number of items added to the cart from the Product Recommendations widgets.
- Cart value — total value of items added to the cart from the Product Recommendations widgets.
- Assisted sales — the income generated through the Product Recommendations widgets. For example, if a user places a $50 order for a product added to the cart via the Featured Products widget on your homepage, it’s an assisted sale of $50 attributed to Searchanise Upsell & Marketing.
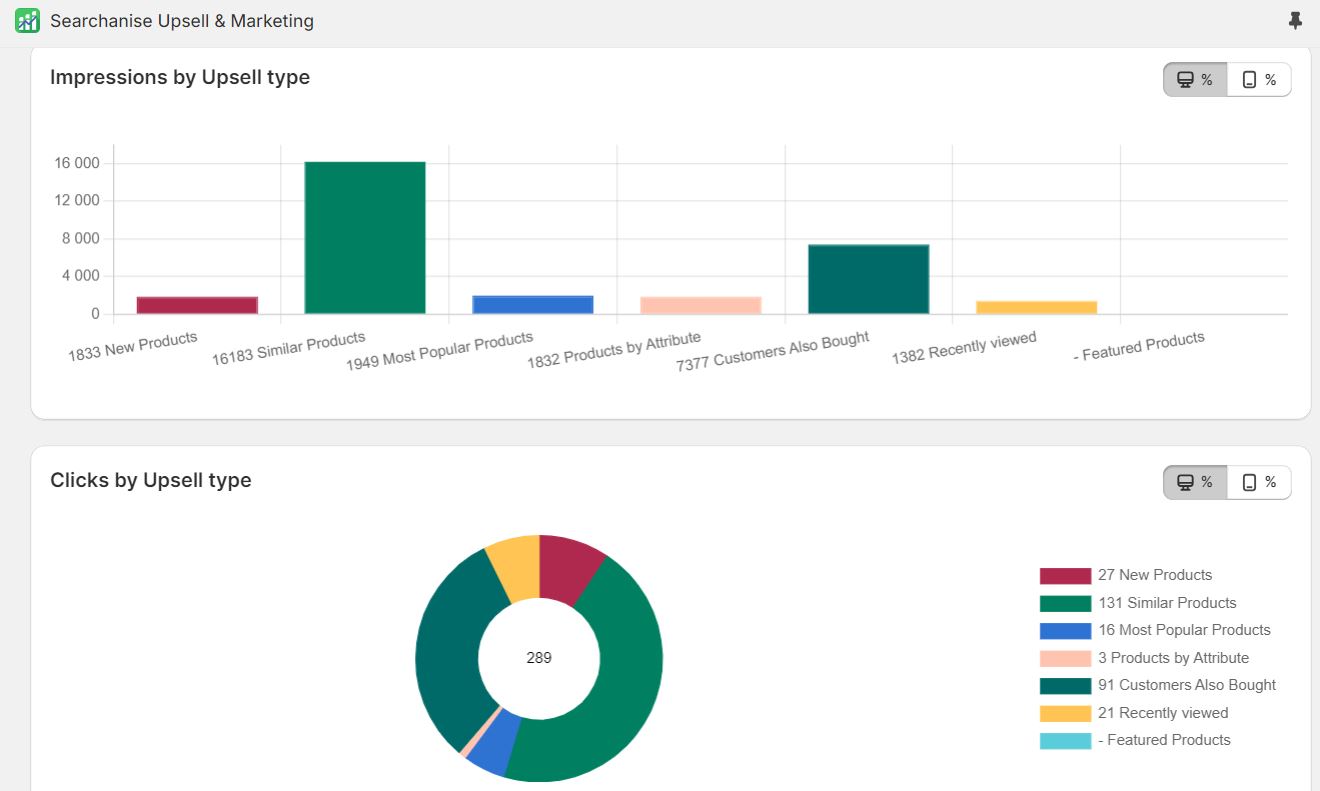
Two graphs demonstrate the metrics of Impressions and Clicks by recommendation type. By clicking the Desktop and Mobile icons you can see the data for each type of device your store visitors were using when they saw the widgets.
Finally, there is analytics for each type of the Upsell & Cross-Sell widgets.
Analytics for Free Shipping Bar
The Free Shipping Bar updates the information on how much customers need to add to the cart to get free delivery. It gives the incentive to add more products and elevates total cart value. Its Analytics data includes:
- Impressions — total number of times the widgets were displayed in your store.
- Goal progress — the number of carts that did not meet the free shipping threshold.
- Goal achieved — the number of carts whose value meets the goal set in the bar’s settings.
- Closed — the number of times a widget was closed.
Two graphs demonstrate the metrics of Impressions and Goal achieved. You can split the data for desktop and mobile devices.
Analytics for Countdown Timer Bar
The Countdown Timer Bar displays the time left before the end of your sale or other promo and can contain a link and a call-to-action button. Use this bar to create a FOMO effect. Its Analytics data includes:
- Impressions — total number of times the bar was displayed in your store.
- Clicks — the number of times the users pressed any elements.
- Closed — the number of times the bar was closed.
Compare these figures with the number of customers who used your special offer and evaluate its efficiency.
Two graphs demonstrate the metrics of Impressions and Clicks. You can split the data for desktop and mobile devices.
Analytics for Email Collection Bar
The Email Collection Bar encourages visitors to sign up and receive a special discount offer. Its Analytics data includes:
- Impressions — total number of times the bar was displayed in your store.
- Clicks — the number of times the users pressed any elements.
- Captured emails — the number of individuals who have signed up for your emails.
- Closed — the number of times the bar was closed.
Two graphs demonstrate the metrics of Impressions and Captured emails. You can split the data for desktop and mobile devices.
Analytics for Multi-Announcement Bar
The Multi-Announcement Bar contains multiple interchanging banners. Its Analytics data includes:
- Impressions — total number of times the bar was displayed in your store.
- Clicks — the number of times the users pressed any elements.
- Closed — the number of times the bar was closed.
Two graphs demonstrate the metrics of Impressions and Clicks. You can split the data for desktop and mobile devices.
Analytics for Scroll to Top Button
The Scroll to Top Button is a sticky button that navigates your visitors to the top of a page with one click. Its Analytics data includes:
- Impressions — total number of times the bar was displayed in your store.
- Clicks — the number of times the users pressed any elements.
Two graphs demonstrate the metrics of Impressions and Clicks. You can split the data for desktop and mobile devices.
Analytics for Pop-ups
The Pop-ups draw attention to your sales, discounts, local pages, etc. Their Analytics data includes:
- Impressions — total number of times the bar was displayed in your store.
- Clicks — the number of times the users pressed any elements.
- Captured emails — the number of emails submitted through Email Collection pop-ups.
Two graphs demonstrate the metrics of Impressions and Clicks. You can split the data for desktop and mobile devices.
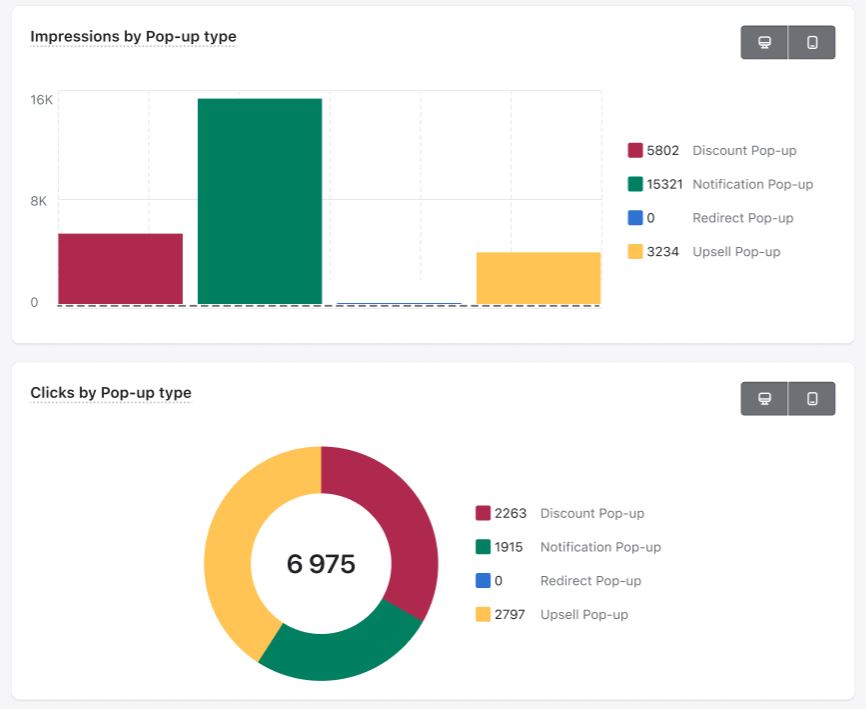
Finally, there is analytics for each type of the Pop-ups.